Interpreting evidence in figures and tables
Interpret changes and uncertainty in experimental data.
Follow worked examples of graph selection and caption revision.
After viewing, complete the online quiz. Repeated attempts are welcome.
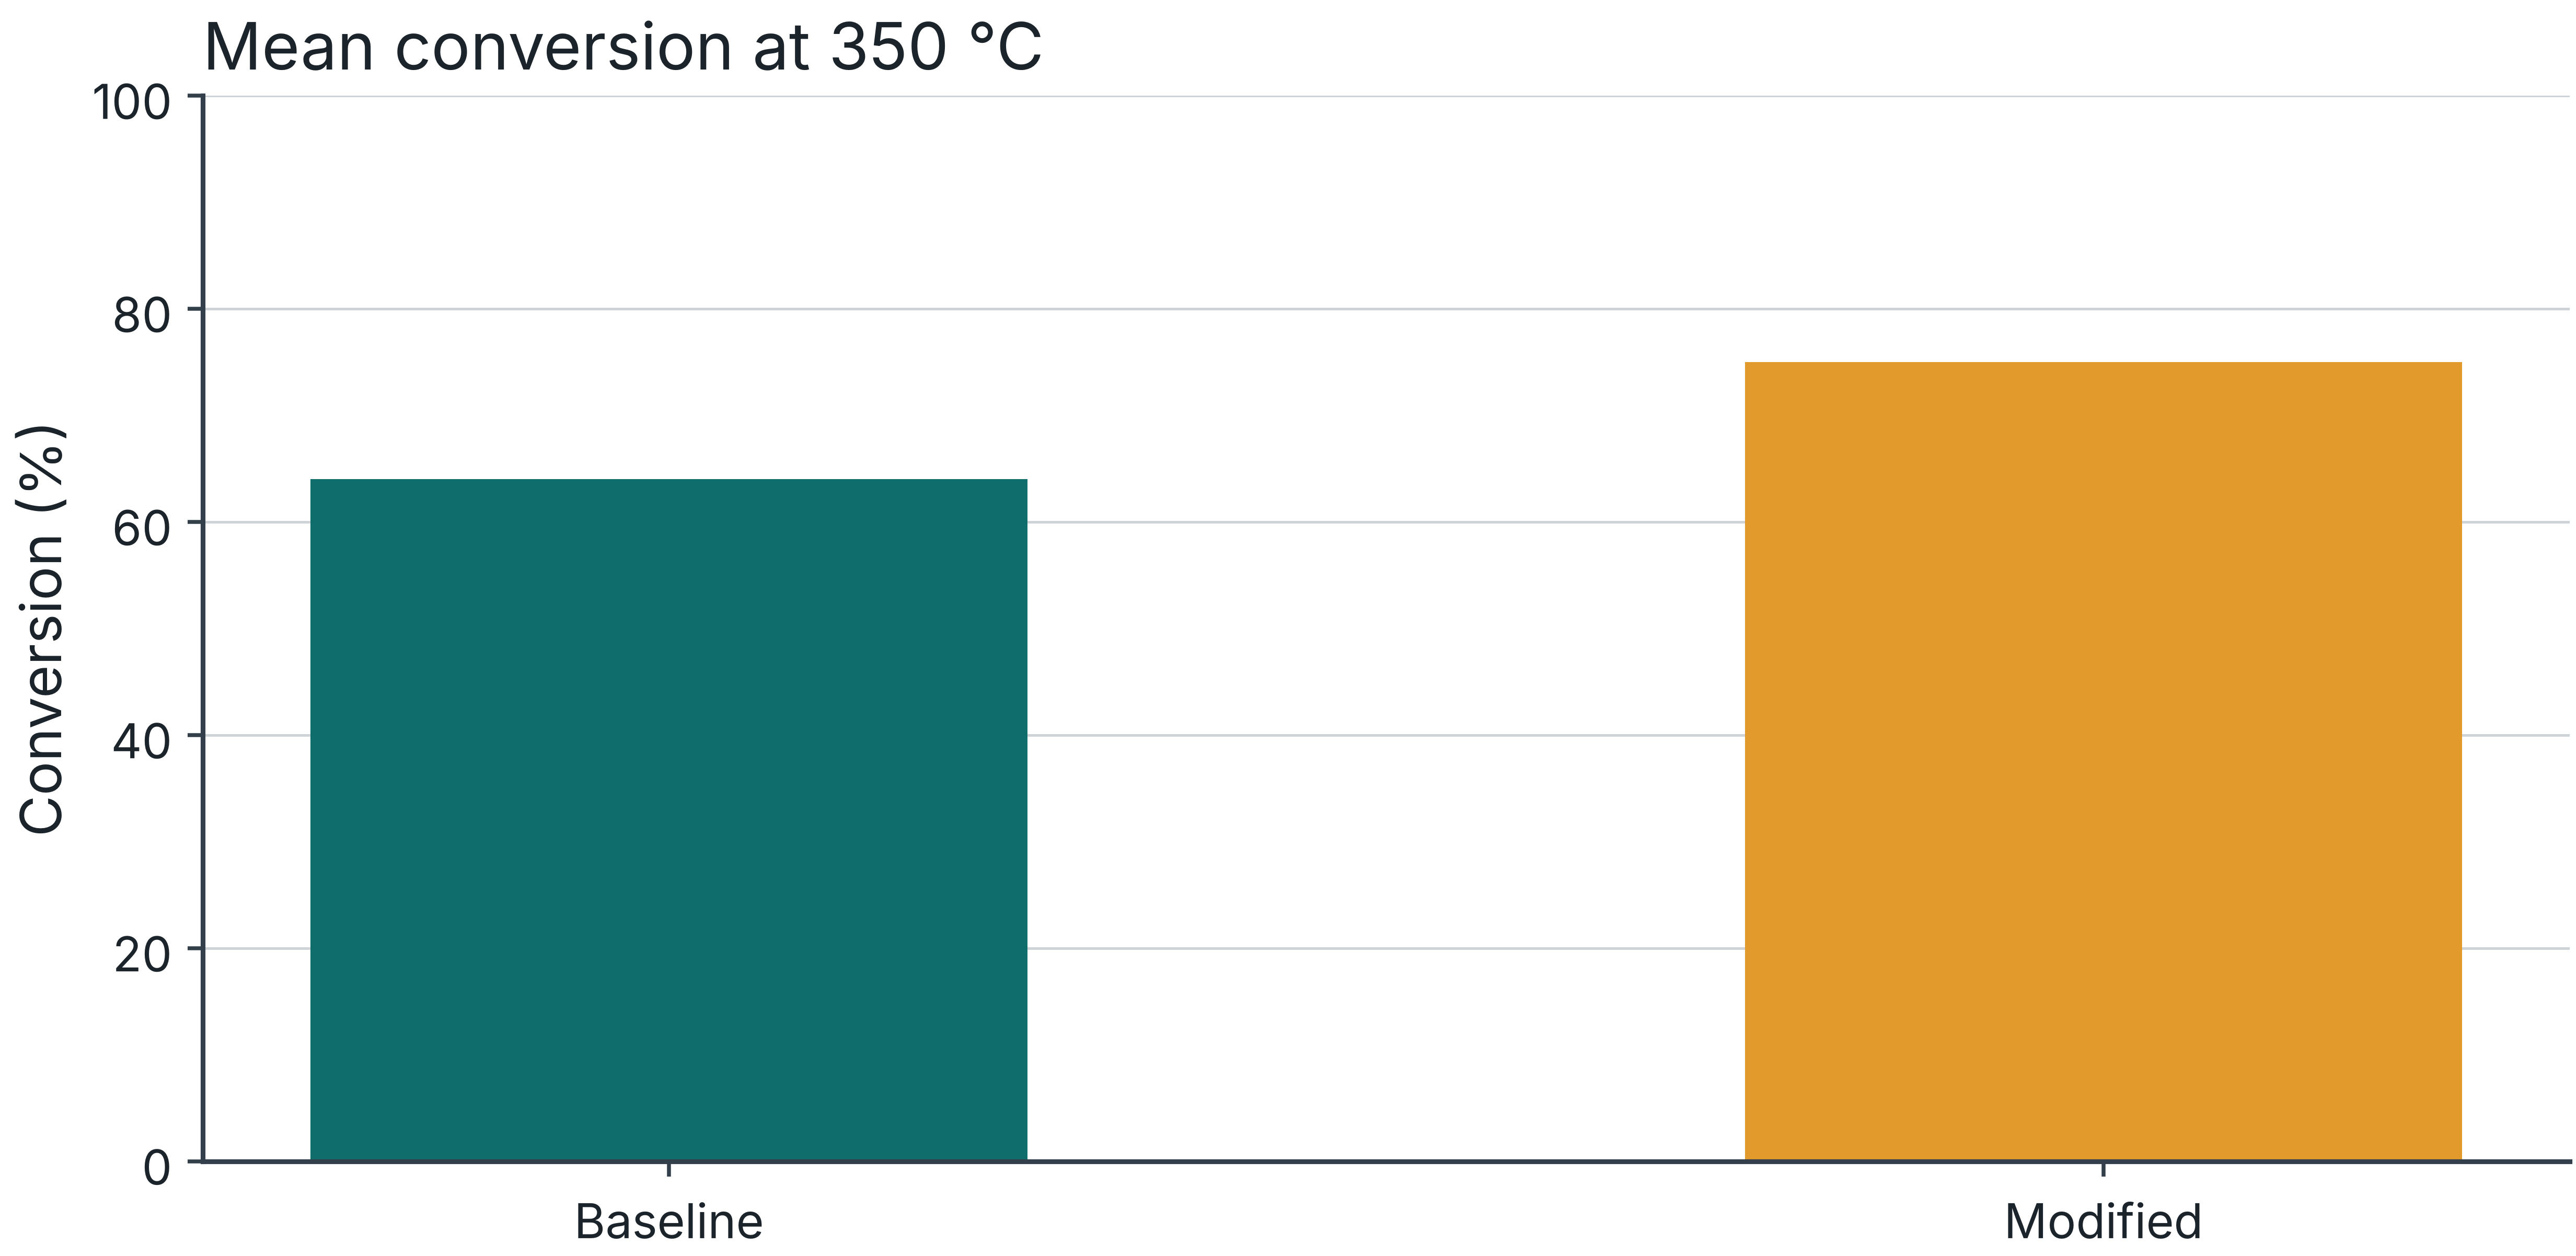
Baseline conversion: 64%. Modified catalyst: 75%.
What is the absolute change? What is the relative change?
Pause the video to calculate both values before the explanation.
Absolute change: 75% − 64% = 11 percentage points.
Relative change: (75 − 64) / 64 × 100 = 17.2%. The denominator is the baseline.
“An 11% relative increase” would give 64 × 1.11 = 71.04%, not 75%.

Intentionally incomplete teaching example. Synthetic data.

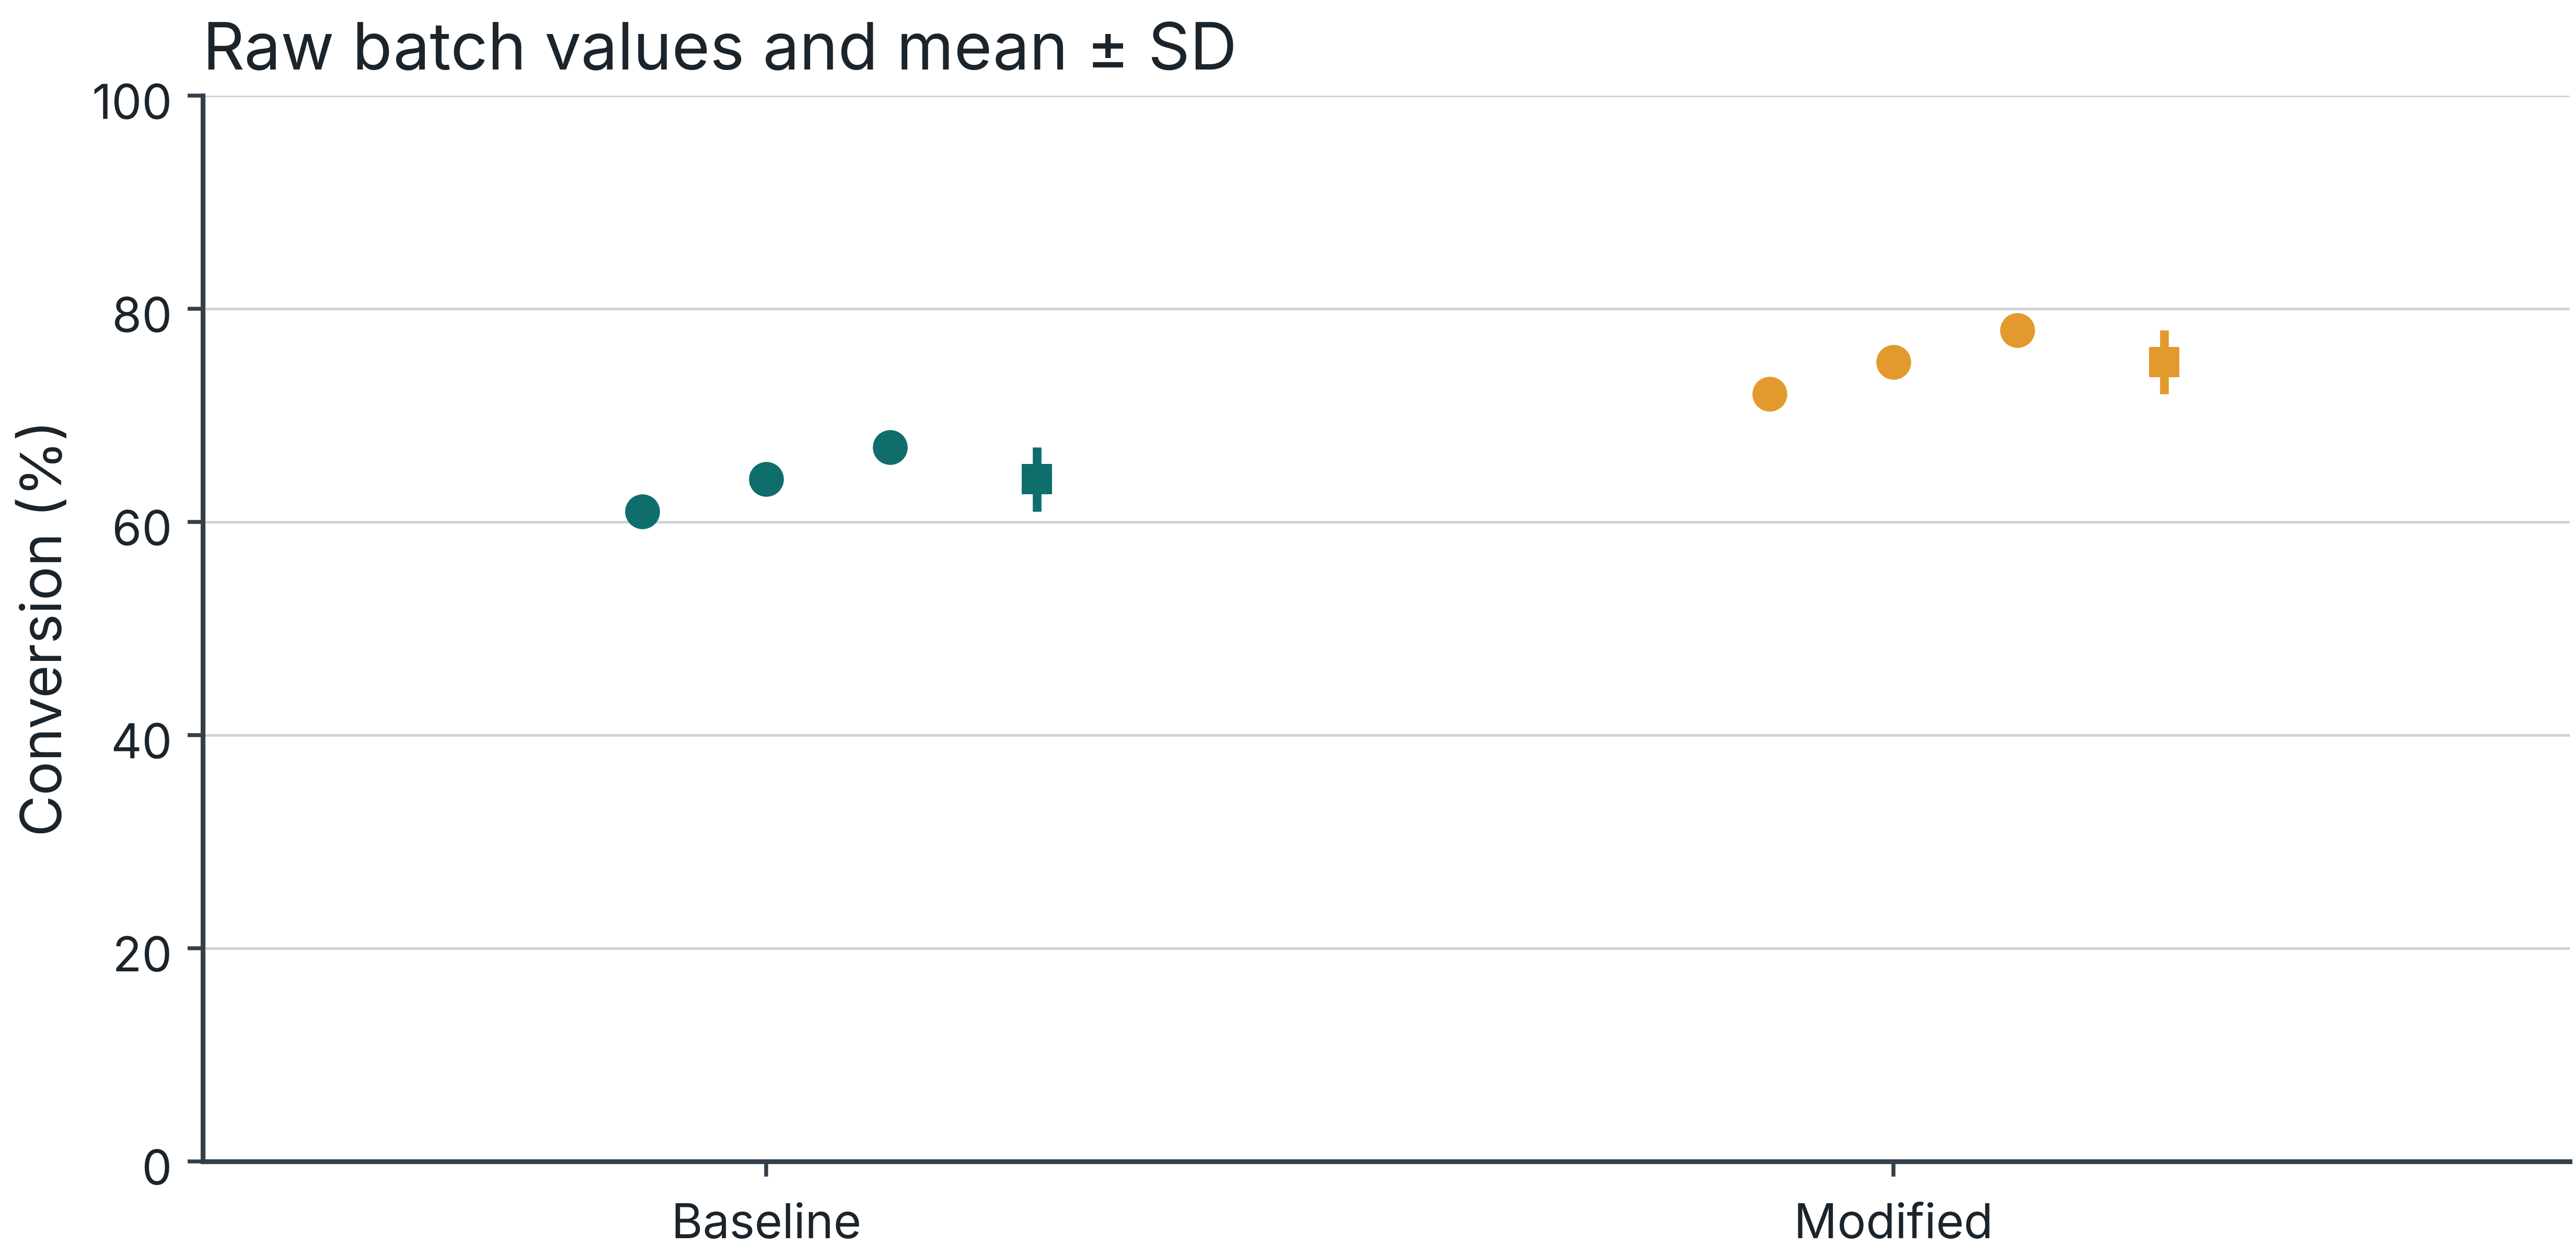
Synthetic conversion data at 350 °C. Points: independent batches. Summary: mean ± sample SD.

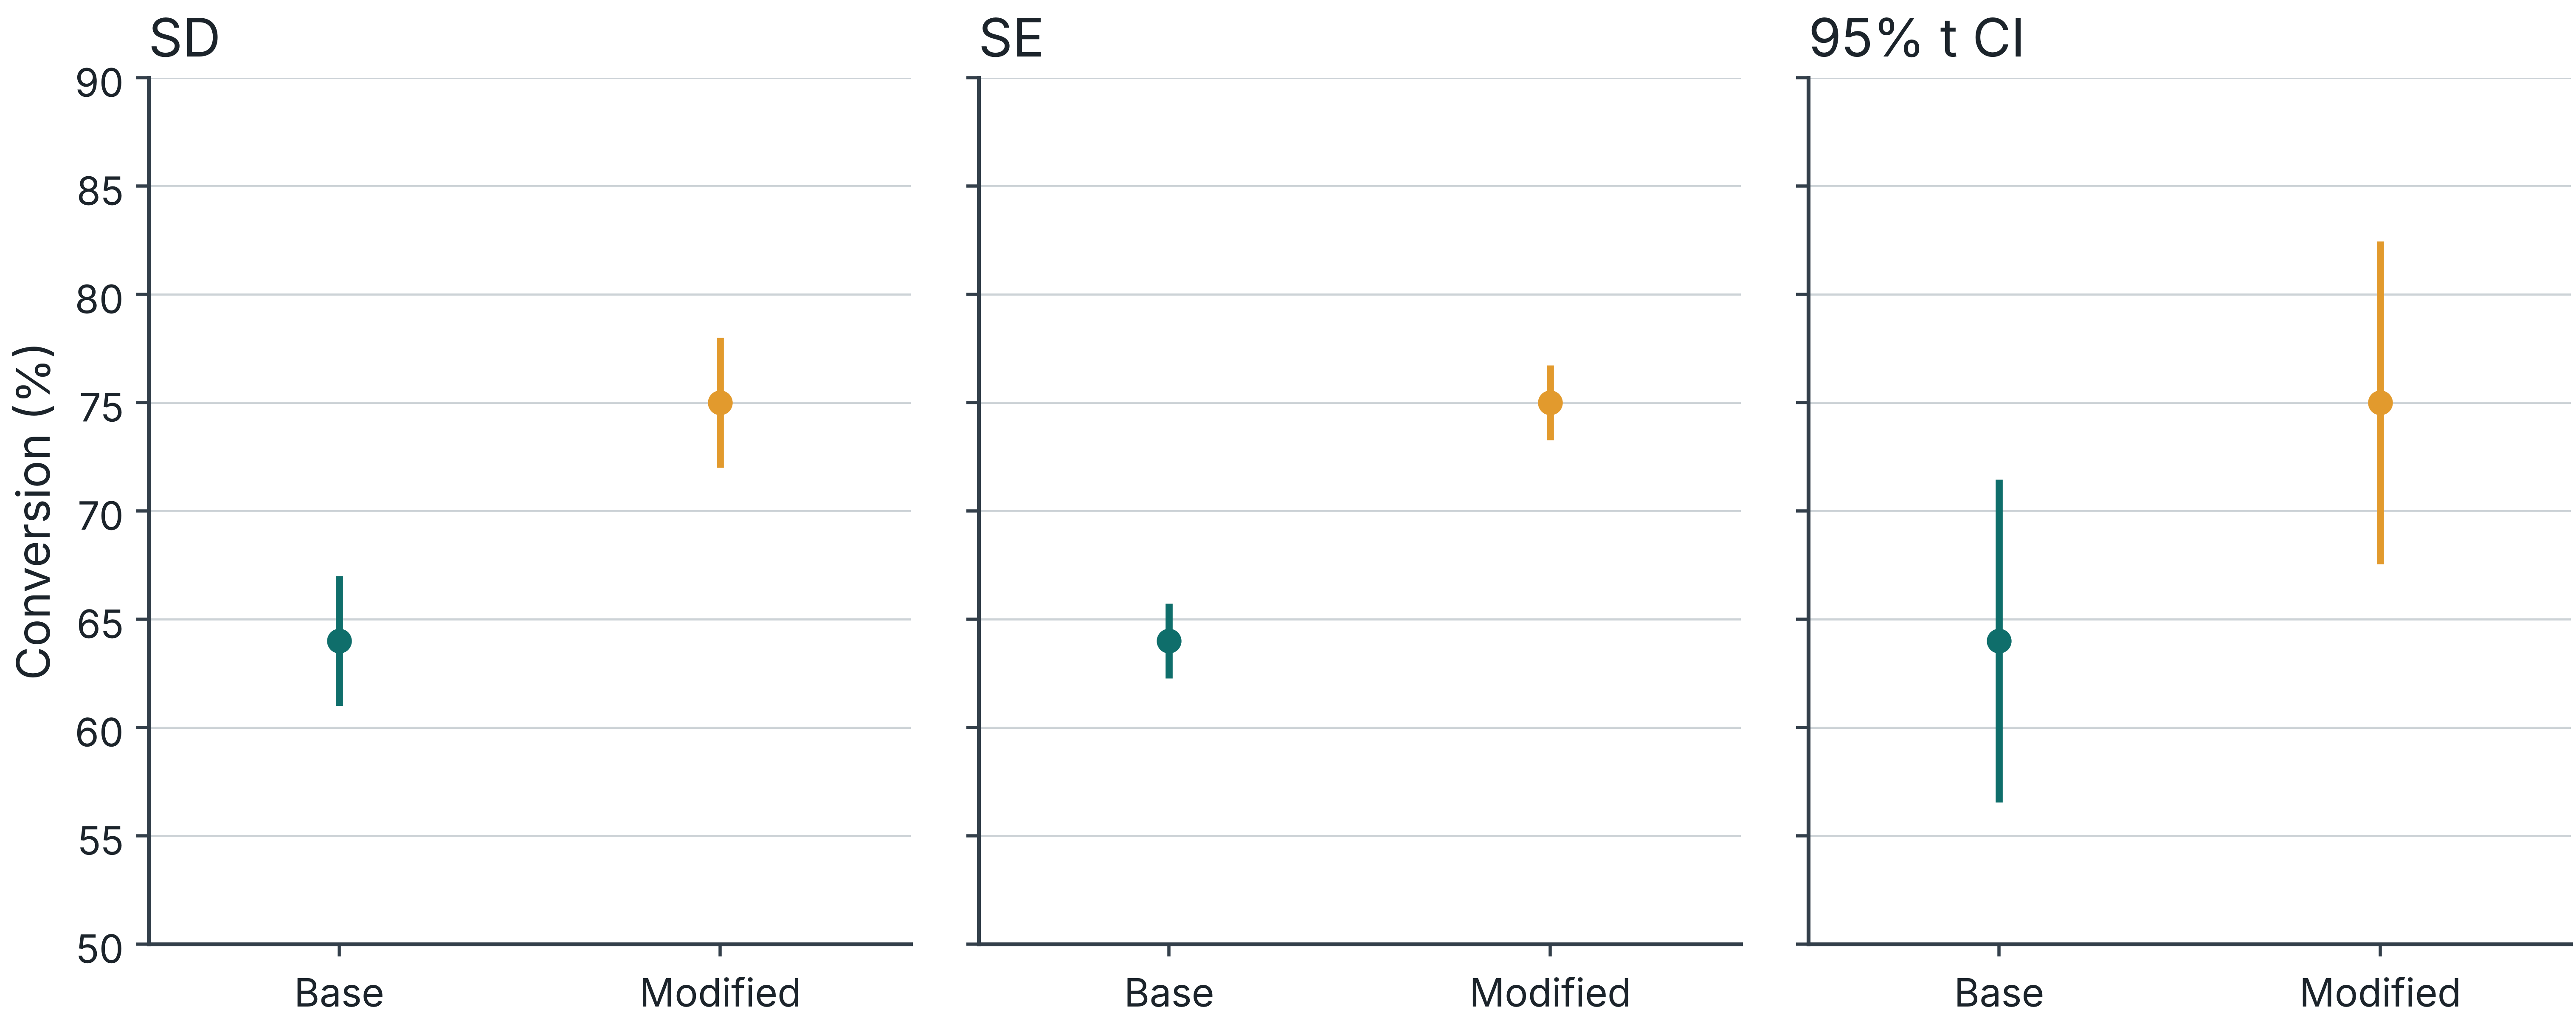
Synthetic data. 95% t intervals assume independent, approximately normal observations. n = 3 per group.

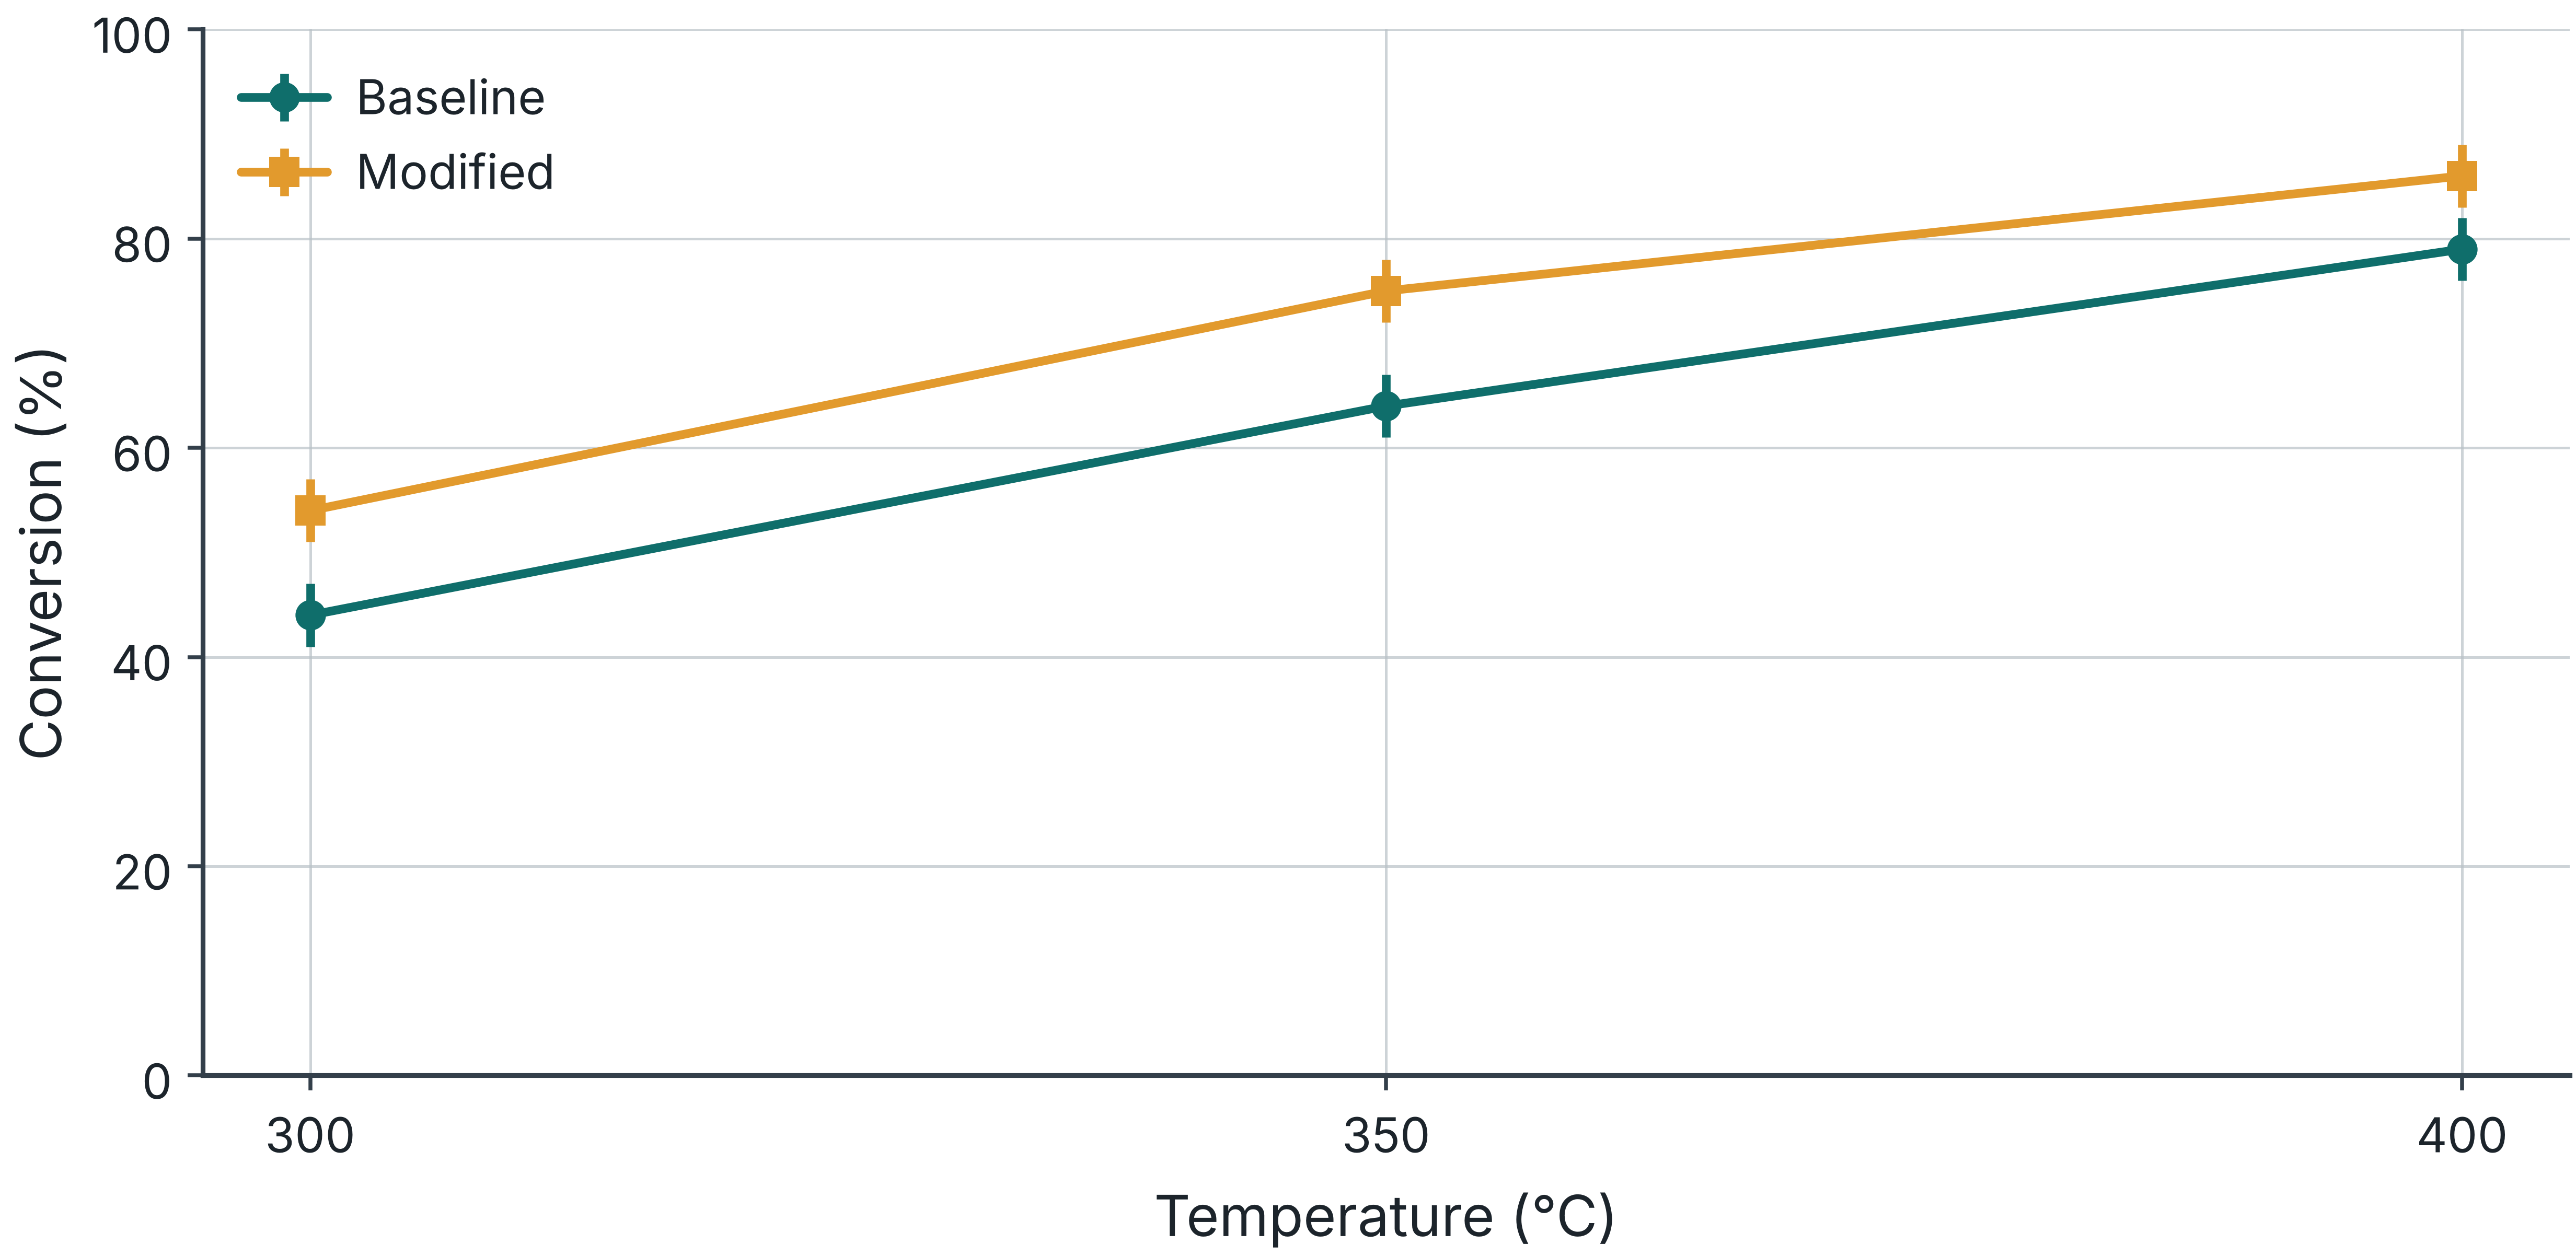
Synthetic data. Mean ± SD, n = 3 independent batches per catalyst at each temperature. Lines guide the eye.
| Metric at 350 °C | Baseline | Modified |
|---|---|---|
| Conversion (%) | 64 | 75 |
| Selectivity to P (%) | 89 | 87 |
| Mean yield to P (%) | 57.0 | 65.2 |
Synthetic paired run data. Yield = conversion × selectivity / 100 for the stated 1:1 molar basis.
For one run with X = 60% and S = 90%, yield = 60 × 90 / 100 = 54%.
Calculate each run’s yield using its own conversion and selectivity.
Average those yields. The product of two means can differ from the mean of paired products.

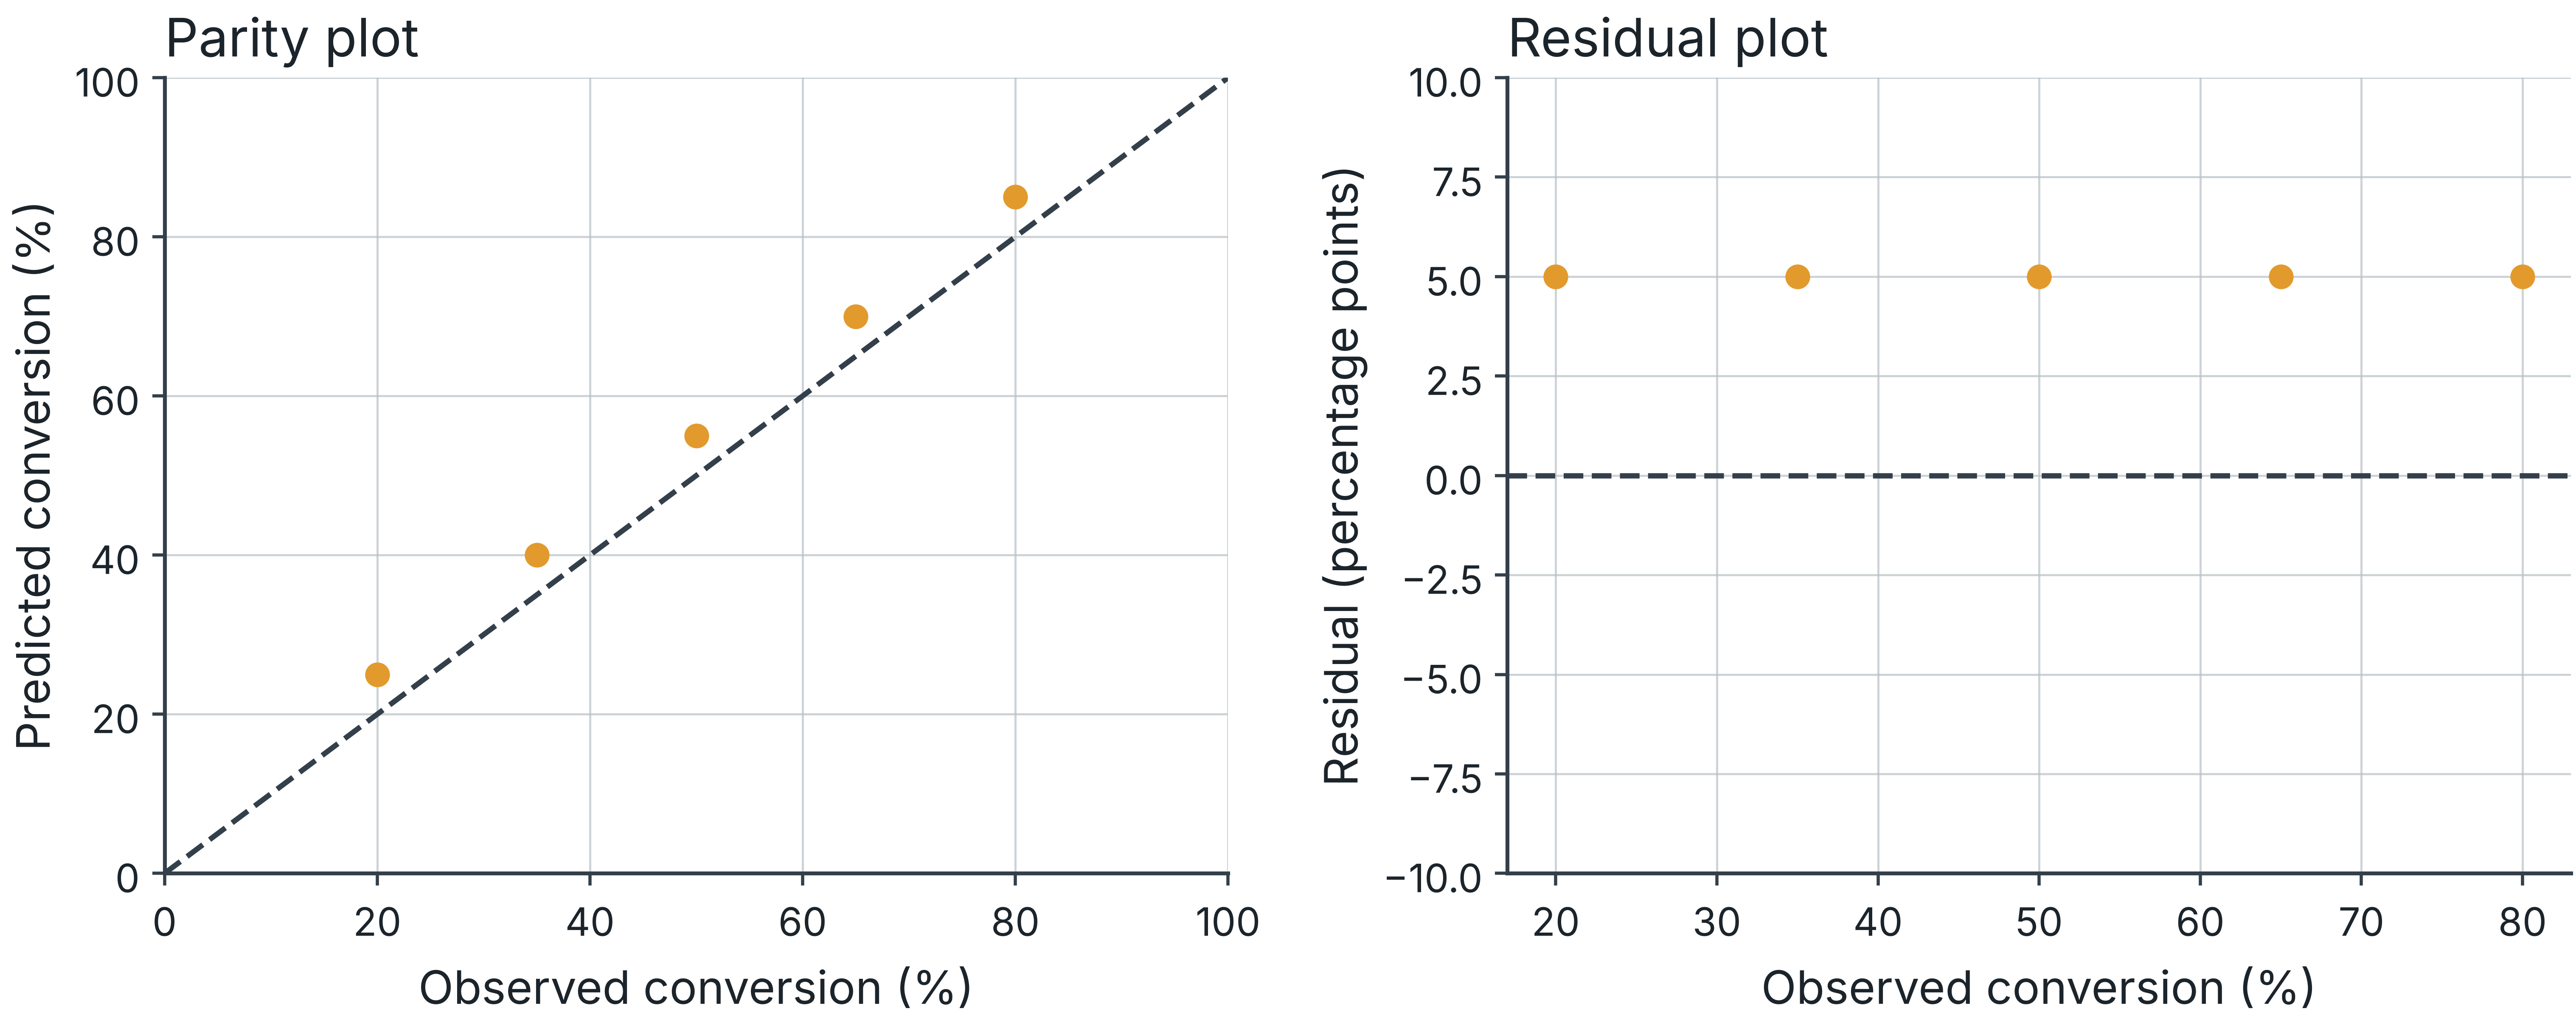
Synthetic model predictions. Residual = predicted − observed conversion. Dashed lines show equality and zero.
At 350 °C, mean conversion was 64% for baseline and 75% for modified catalyst: +11 percentage points (17.2% relative).
Points represent three independent batches per catalyst. Large markers show means; error bars show ±1 SD.
The comparison covers one feed and an 8 h observation window. It does not establish mechanism or industrial lifetime.
Synthetic teaching data. Report the remaining operating conditions in the final caption or linked methods.
What comparison and magnitude does the figure support?
Which conditions, units and normalization apply?
What is n, and what counts as an independent replicate?
What do uncertainty marks mean, and what remains untested?
Question: compare conversion at 350 °C under matched conditions.
Revision: show each independent batch and the mean with a defined uncertainty measure.
Caption: report +11 percentage points, n = 3 per group, and the tested scope.
Put units in the headers.
Use precision that the measurement supports.
Distinguish missing, not measured and not applicable.
Keep each row’s basis of comparison explicit.
Keep raw data unchanged and document exclusions.
Generate the figure from a saved script.
Use consistent scales for panels meant for comparison.
Retain source files, processing steps and permissions.
Draft claim: “The modified catalyst improves conversion by 11% and proves industrial durability.”
Revision: “At 350 °C, conversion increased from 64% to 75%, a gain of 11 percentage points.”
Scope: one feed and an 8 h observation window. Long-term durability remains untested.
Design A: one catalyst batch, measured nine times.
Design B: three independently prepared batches, each measured three times.
For between-batch variation, Design B has n = 3 independent batches.
Conversion changes from 40% to 50% at 300 °C.
Calculate the absolute and relative changes.
Evidence covers one feed over 6 h. Pause to draft one result sentence.
Absolute change: 50 − 40 = 10 percentage points.
Relative change: (50 − 40) / 40 × 100 = 25%.
At 300 °C, conversion rose from 40% to 50% for one feed over 6 h. Longer-term durability remains untested.
Enter your full name and student ID before starting.
Submit a complete attempt for attendance. No passing score is required.
Retry as often as you wish. Explanations appear after submission.
The course page will provide the quiz link.
Attendance records quiz submission. The quiz link will be announced on the course page.
Krzywinski and Altman: Error bars
I&EC Research: Author Guidelines